Introduction
Welcome to your second Data Analytics tutorial.
Please be sure you have done the datatypes tutorial.
We are continuing the adventure by learning essential survial skills.
First we need to know how to decide. Your life may depend on it. So,
you need to be able to execute if in danger do the right
thing then I will be fine else there is
trouble. Once this is mastered we need to learn how to keep on
going. The for and while loops will help us with
that.
If Conditions
Change the boolean variable to FALSE and you should be
in trouble.
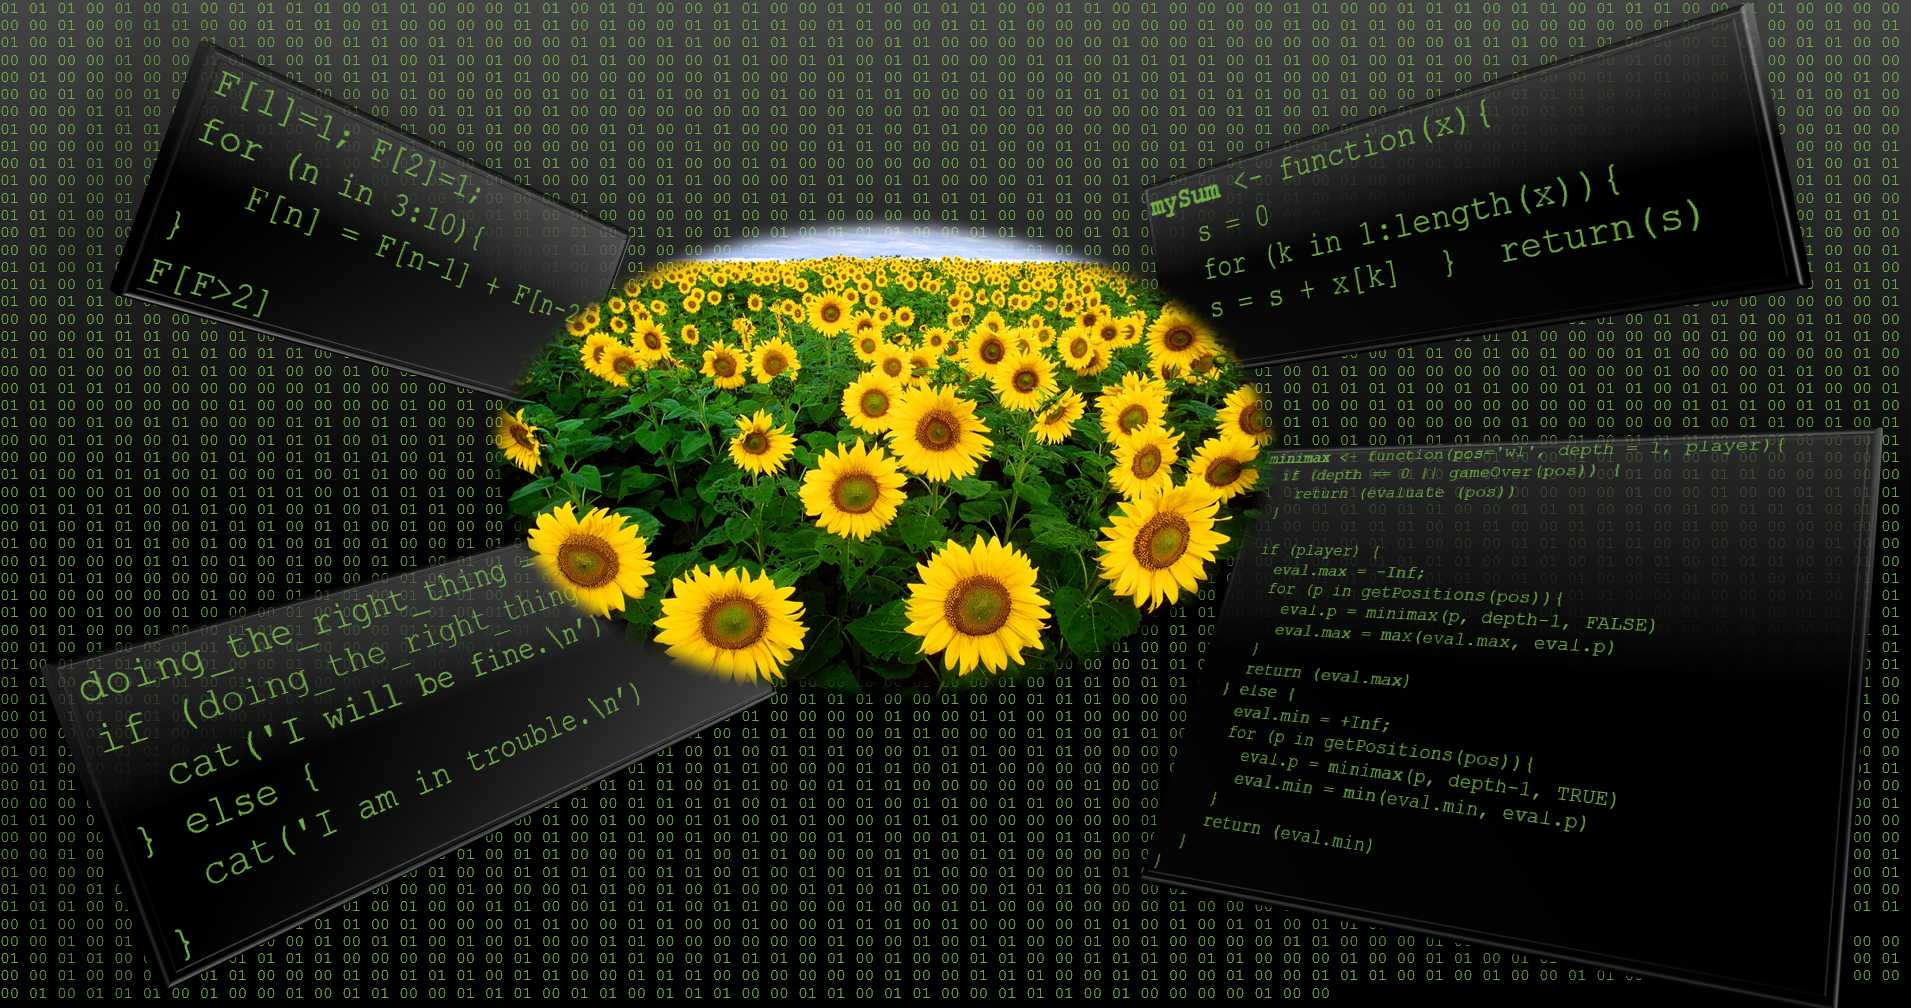
doing_the_right_thing = TRUE
if (doing_the_right_thing == TRUE ){
  cat('I will be fine.\n')
} else {
  cat('I am in trouble.\n')
}
Warning: } else must be on the same line.
Create a boolean variable rain and set it to false.
Write a if clause that displays: “There is a risk of
flooding.” or “everything is fine” (don’t forget \n).
rain = FALSE
if (rain == TRUE ){
  cat('There is a risk of flooding.\n')
} else {
  cat('everything is fine\n')
}
Loops - Control Flow
For loop
Print the numbers 1 to 50 on the console.
for (nb in (1:50)){
  cat(nb,", ", sep = "")
}
Assume you have several machine learning algorithms
rpart, knn, neuralnet,
randomForest, lm and xgbTree.
Iterate through these algorithms.
algos = c('rpart', 'knn', 'neuralnet', 'randomForest', 'lm','xgbTree')
for (alg in algos){
  cat(alg,", ", sep = "")
}
Now display the iteration number as well.
algos = c('rpart', 'knn', 'neuralnet', 'randomForest', 'lm','xgbTree')
nb = 1
for (alg in algos){
  cat(nb,". ", alg,"\n", sep = "")
  nb <- nb+1
}
This will come in “handy” when comparing algorithms.
Loops are often used for aggregation purposes. For instance, you can compute the sum or product of multiple numbers.
Write a for loop that computes the cumulative product using a for loop. That means, multiply the number \(e \in \{2, 4, \dots, 10\}\) and output as variable \(s\)
s = 1
for (e in 2*(1:5)){
  s = s*e
}
s
In order to decipher a code you will need seven Fibonacci numbers, where the first one is greater than two.
\[ F_1=1,~F_2=1,~F_n=F_{n-1}+F_{n-2} \]
F[1]=1; F[2]=1;
for (n in 3:10){
  F[n] = F[n-1] + F[n-2]
}
F[F>2]
While loop
energy = 10
while (energy > 5){
  cat('Energy level ', energy, '\n')
  energy = energy - 2
}
Functions
Introduction
There are many built in functions already. What are typical base
functions? For instance, sum(), mean(),
min(),max() (run
library(help = "base") for a comprehensive list).
Let us re-implement sum as a script using a
for loop.
x = c(1,2,3,4) # given vector
s = 0 # our summation variable
for (k in 1:length(x)){
  s = s + x[k] # add element to sum
}
s  # display result
Now let us use use the above as function and name it:
mySum()
# define a function
mySum <- function(x){
  s = 0
  for (k in 1:length(x)){
    s = s + x[k]
  }
  return(s)
}

# use the function
x = c(1,2,3,4) # given vector
mySum(x) # call the function
Let us reflect on the above function. mySum is the
function name. Then we assign <- a function block
function(x){}, where x is an input variable.
The function return() returns the results from within the
function’s body to the environment (workspace) in which it was
called.
Practice makes perfect
Write the function myMin which determines the minimum.
Then write x=c(65,70,24,26,36,65,83,34,42,34) and return
the minimum using your function.
myMin <- function(x){
  m = Inf # special means m is at infinity
  for (k in 1:length(x)){
    if (x[k]<m) m = x[k];
  }
  return(m)
}

# use function
x=c(65,70,24,26,36,65,83,34,42,34)
myMin(x)
Several input/output variables
What if we have several input variables? Let us have a function that multiplies three numbers.
multi3 <- function(a,b,c){ return(a*b*c)}
multi3 (2,3,4)
What if we have several output variables? Let us return the variables a,b and c.
ret3 <- function(){
  L = null; # initialise empty list
  L$a = 1; L$b = 2; L$c = 3;
  return(L)
}
ret3()
Practicalities
What to do - if you have written many functions, which you will use several times in your project?
Easiest way is to collect them in one r-file and then use the
source command to load them.
What to do - if you have written many functions, which you will use several times in many projects?
In this case it pays-off to create a package.
Resources
- Another Data Analytics tutorial “Data Analytics Tutorial for Beginners - From Beginner to Pro in 10 Mins! - DataFlair” (2019)
- Brauer (2020) is a very short introduction to R
- Field (2021) is a great book to discover statistics using R
- Shah (2020) is a hands-on introduction to data science (Chapter 6 explains R)
Acknowledgment
This tutorial was created using RStudio, R, rmarkdown, and many other
tools and libraries. The packages learnr and
gradethis were particularly useful. I’m very grateful to Prof. Andy
Field for sharing his disovr package,
which allowed me to improve the style of this tutorial and get more
familiar with learnr. Allison Horst wrote a very
instructive blog “Teach
R with learnr: a powerful tool for remote teaching”, which
encouraged me to continue with learnr. By the way, I find
her statistic
illustrations amazing.
References